


Climate Action
Climate science is indisputable. The earth is heating and humans are the cause.
Since 1910, Australia's climate has warmed by more than 1 degree Celsius.
Australia is already experiencing the impacts of a changing climate, particularly changes associated with increases in temperature, frequency and intensity of heatwaves, hazardous fire weather and drought conditions.
What does this mean for the Granite Belt?
The Granite Belt is known for being the coolest place in Queensland, and our climate is a drawcard for both tourism and horticulture.
As the climate heats our summers will gradually become too hot to grow our current summer crops such as tomatoes, capsicums & zucchini.
Climate change is already impacting the wine grapes, as evidenced by changes in grape phenology and harvest dates, which has led to compressed harvests and greater pressure on vineyard and winery infrastructure.
Our minimum temperatures in winter will increase and eventually be too warm for fruit trees to receive adequate chill for fruit to form, and we will lose the ability to grow apples & many stonefruits.
Heatwaves will become more common, more severe, and longer lasting. Heatwaves have real impacts on human health and wellbeing – leading to heat exhaustion or even heat stroke.
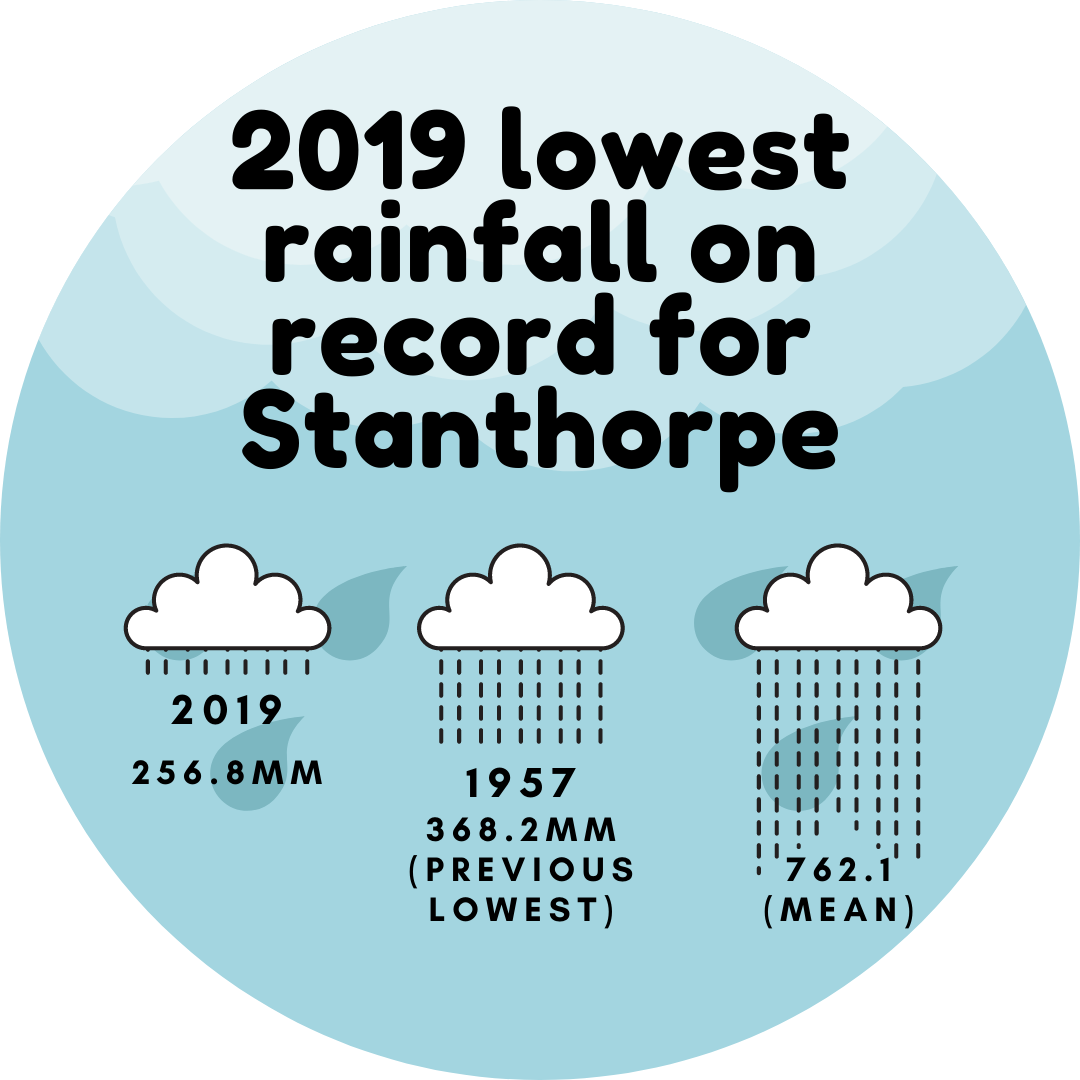
As temperatures increase the air holds more moisture (7% more for every degree of heating). This will mean more evaporation, and longer dry times between rainfall events. The drought of 2018-2019 occurred without an El Nino. Temperatures during La Nina years are now hotter than El Nino years during the 1980s.
Bushfire risk will increase as temperatures increase.
Regular weather patterns will change as the oceans continue to heat and vary their natural patterns.
Losing our “cool climate” status will mean our main winter tourism market will diminish.
New pests will reach our region - already ticks have arrived in the past couple of years. Cane toads that normally cannot survive in our cooler winters will be able to move into the region as the climate heats.
More information
What can we do?
Join GBSAN & the communications team to work on ways of engaging our community and driving real change
Write to your state & federal MPs
"How to Get Your Local MP to Listen to Your Community" - written by Saffron Zomer and the team at the Australian Conservation Foundation
"The Do's and Don'ts of Lobbying MPs" - written by Andrew Wilkie MP's office
How to Engage Our MPs on Climate - Climate for Change
Join, follow & donate to (if you can) climate action groups, such as:
Talk to family & friends about your concerns
Read books about the climate crisis & movement
Listen to podcasts
Watch

Average daily maximum from 1960-1990 was 21.4.

Predictions of the future as temperatures continue to increase.

Australian mean temperature anomaly since 1910.

Global mean temperatures 1851-2020

The costs of inaction are much more than the costs of action.

La Nina years are now warmer than El Nino years in the 1980s.

Australia is one of the highest emitters per capita of CO2.

Thousands of years of Carbon Dioxide records.


The estimated average daily maximum by 2050 is 26.4, if we continue on the trajectory we are currently on. Our autumn and spring temperatures will become our winter temperatures, and summer will extend for over 6 months.

Australia’s climate and oceans have warmed significantly since records began.

BOM chart showing temperature anomalies for the past 110 years.

Scientists have warned about coal affecting temperatures for over a century.

Climate change exacerbates all other pressures.
Every state and territory in Australia has a net-zero target (but not the federal government).

There are multiple lines of evidence that show the climate system is changing. These include:
record high surface air temperatures
increased average number of hot days per year
decreased average number of cold days per year
increasing intensity and frequency of extreme events (e.g. fires, floods)
changing rainfall patterns
increasing sea surface temperatures
rising sea levels
increasing ocean heat content
increasing ocean acidification
changing Southern Ocean currents
melting ice caps and glaciers
decreasing Arctic sea ice
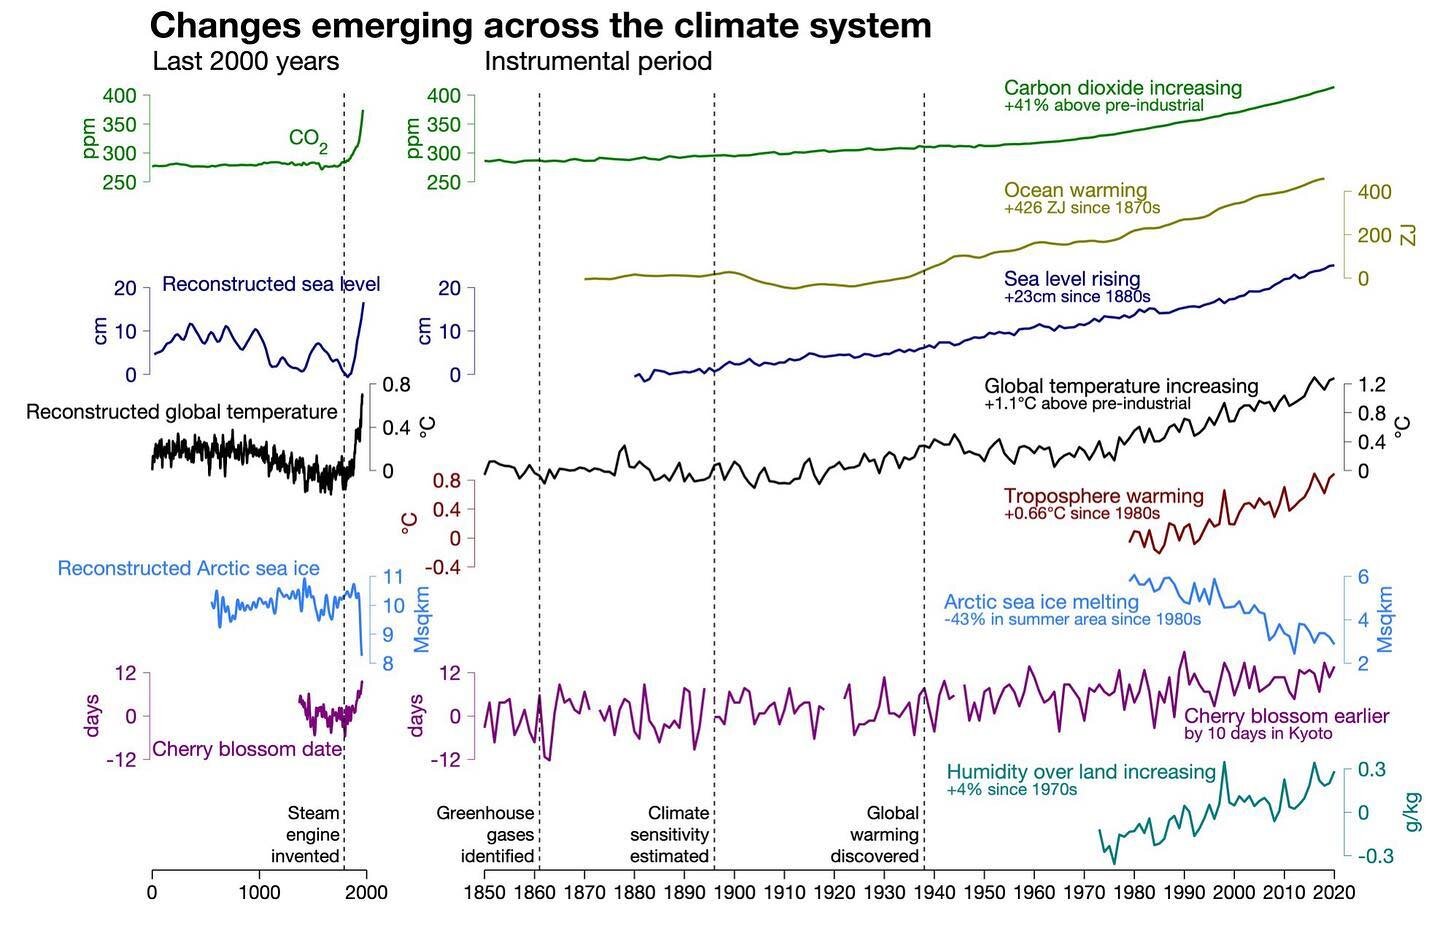
More indicators of a warming climate.

Global monthly temperature anomaly (relative to 1901-2000 average) NOAA

Not one scientific organisation worldwide doubts climate science (except for fossil fuel funded groups)

Shifting Distribution of Land Temperature Anomalies, 1951-2020, NASA